Im getting the pictures arranged but Id like to start with the firmware. Its taken a bit to develop mostly because I never succumb to the old addage that " good is fine, better is worse". I started out simple wanting to chenge out the old LCD screens for new TFT LCD touchscreens. I wanted to reduce the switches on the console, and what better way to incorporate that than using touchscreens. They are a little tricky in that you need to make them trigger when you touch them, but how you touch them makes a big difference. For instance if you have big fingertips, sorta like I do, making the buttons on the screen really close together to maximize the space, wont work. You will end up with two buttons pressed instead of one, not good. But, if you narrow up the trigger area too much, you end up needing to use a toothpick to make stuff happen...its all about compromise.
The first arduino sketch Ill start with is the one for the GPS screen. In the old console I just had a LCD screen reading out lat, longitude, altitude and the satellites in view. In the new screen, I do all of that PLUS I added speed, direction, and a graphical representation of altitude including color coding the graph based on altitude...........
So the sketch..........

You will see all the libraries you need. Likewise I used the Adafruit fontconverter program using my Linux box and uploaded several new fonts. I like these fonts because they are easily read even at a 7,8 or 9pt font size.
You will also see I like to mess with colors. Most of these arent used but I usually import all the RGR565 colors I have used in the past to see how things look
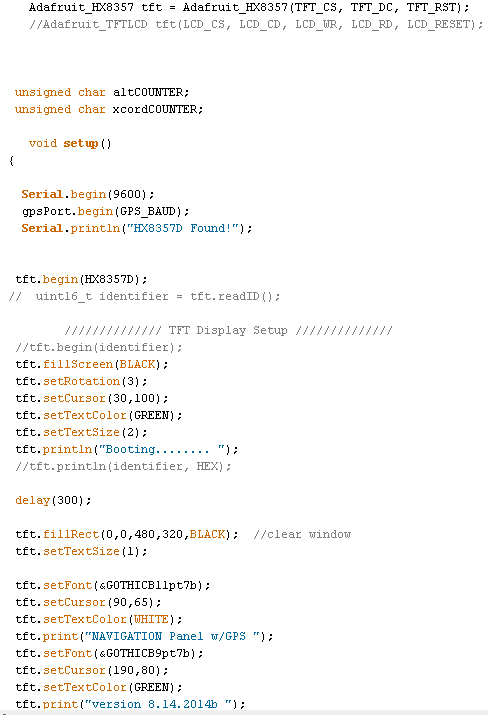
This next section is nothing more than setting up the TFT screen, clearing the screen when starting or rebooting, and then a little splash screen just for fun

This next section does nothing more than set up the individual windows in which the real time(ish) data will be displayed. I say real time(ish) because when displaying stuff on a TFT screen you must destroy the previous data displayed and rewrite the new data. With everything Im displaying, this all takes about a second using the Arduino Mega....so all updates are roughly every second. There is alos a built in delay in the sketch to allow new NEMA sentences to be fully read and displayed


The simple void loop. It calls the main GPS data printing loop and also adds the 1sec delay to ingest all the NEMA data

This is where the fun begins. The GPSInfo loop. At the begining of the loop you will see that counter that I initially set to 0 in the setup up. This counter will increment by 1 with each pass of the loop. The rest of this section is showing the typical
set up for displaying the data. You remember in the SETUP we created the data display window. We ingest the data, then before displaying it, we destroy the old data with the tft.fillRect( ) statement. This paints a black square over the old data the same size as the box we set up in the setup. This way we retain the original set params and clear the window. The rest of the commands are setting the font, font color, location and finally printing the new data. This is done exactly the same for all the windows.
Altitude graphing:

The altCOUNTER is the counter we increment by 1 with each pass. Therefore with the counter reaches 16 ( it starts out at 1, with the first pass) this sets us up for making a altitude graph entry ever 15 secs.
Then I do a little math. All of the variables are floats. I know it takes a little arduino horsepower to do floats, and yes I could have declared them earlier, but I did this over a couple of days, and in sections so it
ended up like this. All you programming gurus out there please dont slam me with a bunch of comments, I acknowledge its not pretty, but functional. yyfeet is the actual reading from the GPS in feet like 456.78ft of altitude. next to reduce this so I can fit it on the screen of the TFT, I divide this by 100. The reason for this is my graph will show a traversed path from 0 to 10000ft of elevation. I would suspect I probably wont drive to Pikes Peak, or anywhere above 10000ft, if I do the graph will just brickwall at this elevation. So now we have a altitude of 456.78ft, reduced to 4.4567.
The window to display the graph is a window thats 100pixels tall ( 10000ft) and 400 pixels wide. Originally I had the graph display a 10 minute traveled path, the final result is much longer. if you take the 400pixels and divide it by the 15 sec measurements, you get a little over 9 mins which was my original thoughy.
The coordinates of the window are 30,319. just a little left and nearly at the bottom of the tft screen which is 320pixels in height The ycord = 319-yy is to make the y coordinate land at the bottom
The xcord, is the x coordinate. Since we want to display the altitude over a time frame, its necessary to plot the x coordinate, and one the next measurement move this to the right by some fixed distance and plot the new data. This way you end up with a series of rectangles, drawn based on the altitude (yy). Since we are using the tft drawRect( ) command, you need an x coordinate, a y coordinate, a height, a width, and a color) so then we just substitute in all our variables and we tell the arduino to draw a rectangle based on the altitude.... or.....
tft.fillRect( xcord,ycord,2.5,yy,BLACK) this tells the arduino to draw a rectangle at the current (x,y) coordiantes, with a width of 2.5pixels, at a height of (yy) which is our calculated height in the color BLACK.
Now in order to get the arduino to draw the new altitude rectangle to the right of the last one so we have a history being drawn on the screen..... we have to add in another counter. This counter (xcordCOUNTER) counts the rectangles drawn and when it gets to 144, then it will wipe the graph clean and start over with a new one. xcordCOUNTER reaching 144 is enough to show a traveled history of 36 mins ( 144counts * 15secs = 2160 / 60 = 36mins) You can change this to whatever you want.
All if the "if" statements preceding are to change the color of the graph based on the altitude. From 0-5280ft the graph is black, from 5280ft to 6000 ft its CYAN, and so on......
Direction Traveling:

Finally here is what the screen looks like. The graph at the bottom unfortunately is nearly flat because its sitting in my room....but it works

In the meantime.........happy coding!